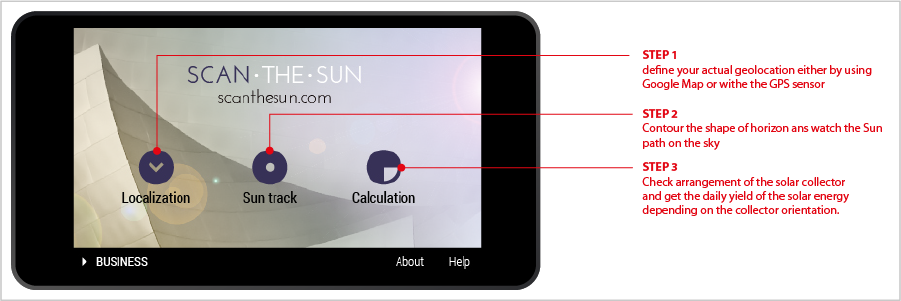
Structure of the ScanTheSun app is based on three STEPS.
- STEP 1 defines your geolocation either with Google Maps or with the GPS sensor.
- STEP 2 is an extended reality application, where all measurements related to the surroundings of the PV-panel or collector are performed.
- STEP 3 calculates the yield of the solar energy as a function of the panels orientation.The calculation takes into account all obstacles around, like trees or buildings.
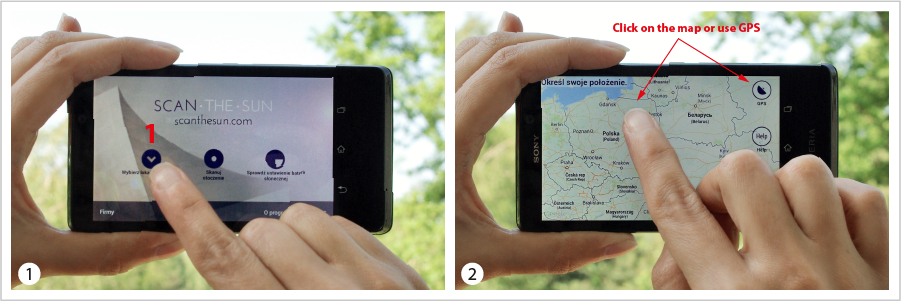
Define your geolocation. Your actual geographical location is essential in calculating the available solar energy.
- either click on the map
- or use GPS button
- Click 'Proceed' button to save your location data in memory and return to main application screen.
Click 'Contour the horizon shape' to perform all measurements related to surroundings of your panels. In most cases solar panels are mounted in the midst of trees, buildings or other obstacles hindering the sunlight.
- The horizon contour will take into account that complicated surrounding.
- In this way it is possible to reliably adjust a panel even in extremely difficult areas like city centres, wooded areas, gardens.
All functions needed in making the contour of horizon are displayed on the vertical slide menu.
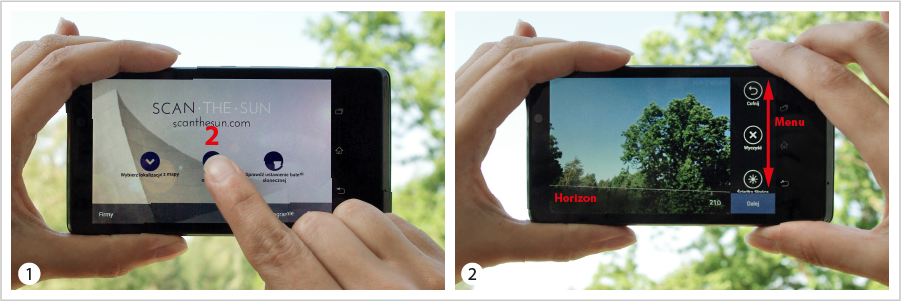
Go to the place where your solar panel will be mounted.
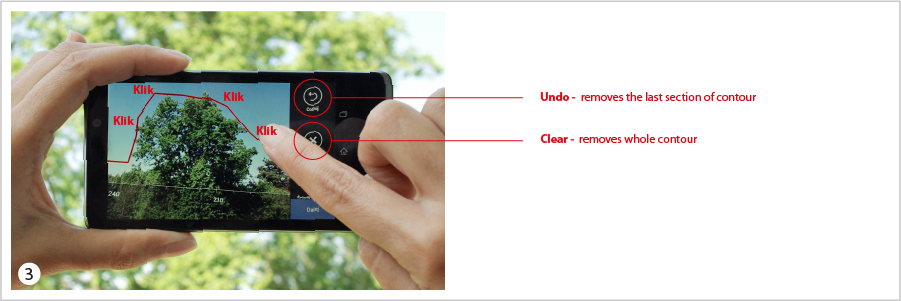
- Contour the shape of horizon in that place by tapping on the camera preview screen.
- If corrections are required use the 'Undo' and 'Clear' buttons.
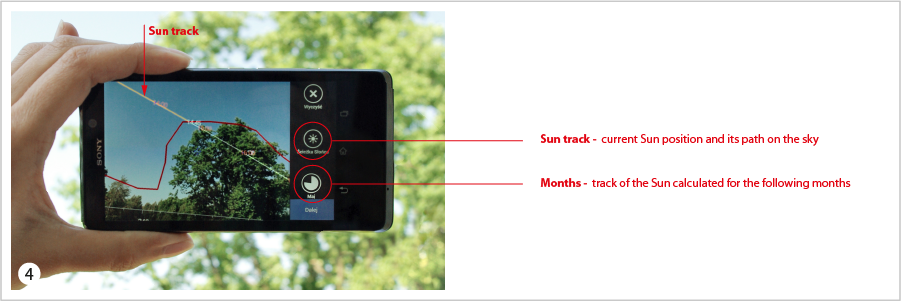
Display the track of the sun on the camera preview.
- 'Sun Track' button lets you draw the Suns current position and it's expected track in the sky.
- You may check the track of the Sun for any month by clicking the button with the month's name.
- Click 'Proceed' button to save your horizon line in memory and return to main application screen.
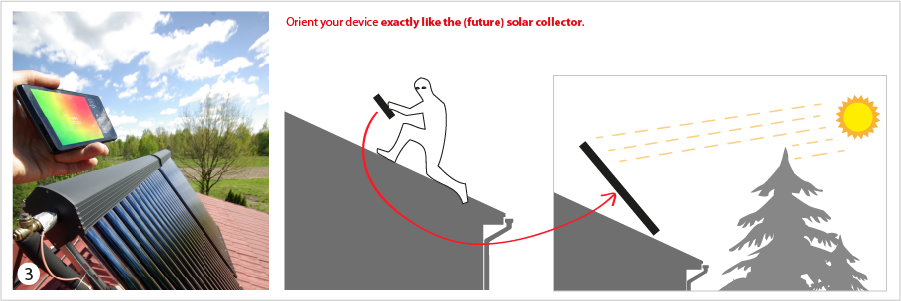
Click 'Adjust solar panel' button. From now on treat your phone/tablet as a solar panel.
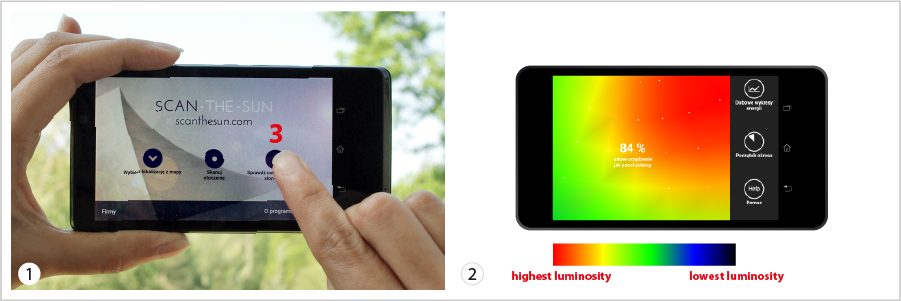
- The percentage of available solar energy collected by the panel is drawn on the screen together with a colour map.
- Watch how the percentage changes with the device orientation.
- Areas coloured red show directions of the highest energy collection while those coloured blue and black show directions of the lowest energy collection.
- Orient your device exactly like the (future) solar panel to read how much of the available energy will be collected.
- The calculated energy takes into account the contoured horizon, i.e., all obstacles like trees or buildings hindering the sunlight.
'Select period' button allows you to select the working period of the solar panel. For example, by selecting May and September as the beginning and end of the period respectively, the colour-gradient map will change showing the best orientation of the solar panel to collect energy from the start of May up to the end of September each year.
- If you want to optimize the energy collection for a specific season select its beginning and end from the month lists.
- Otherwise leave the default value of 12 months.
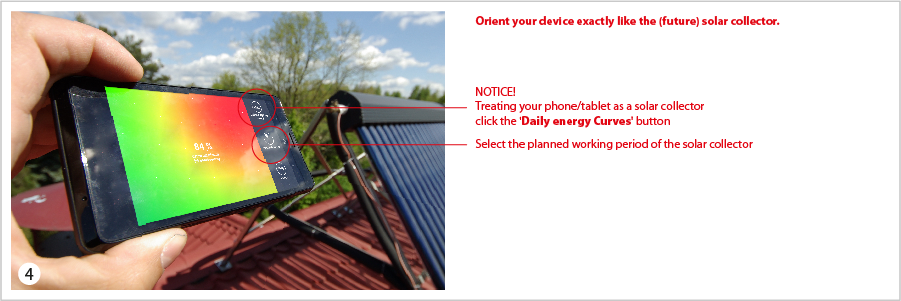
- Orient your device like the solar panel.
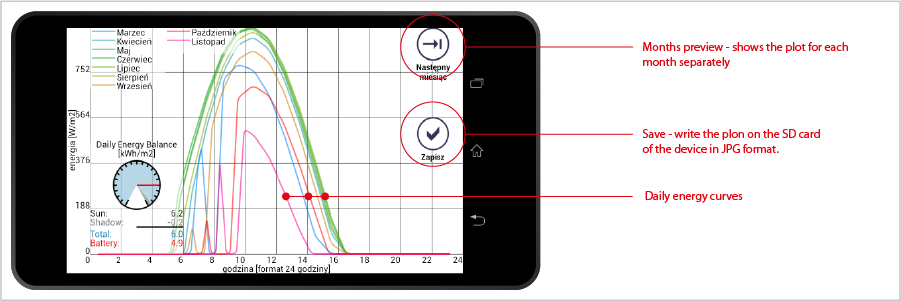
- Keeping that orientation click the 'Daily energy Curves' button.
The 'Daily energy curves' plot will appear showing the solar power collection as a function of time (int 24 hours format). This plot is helpful in predicting the hour of water warming for house usage etc.
